Visual Vocabulary
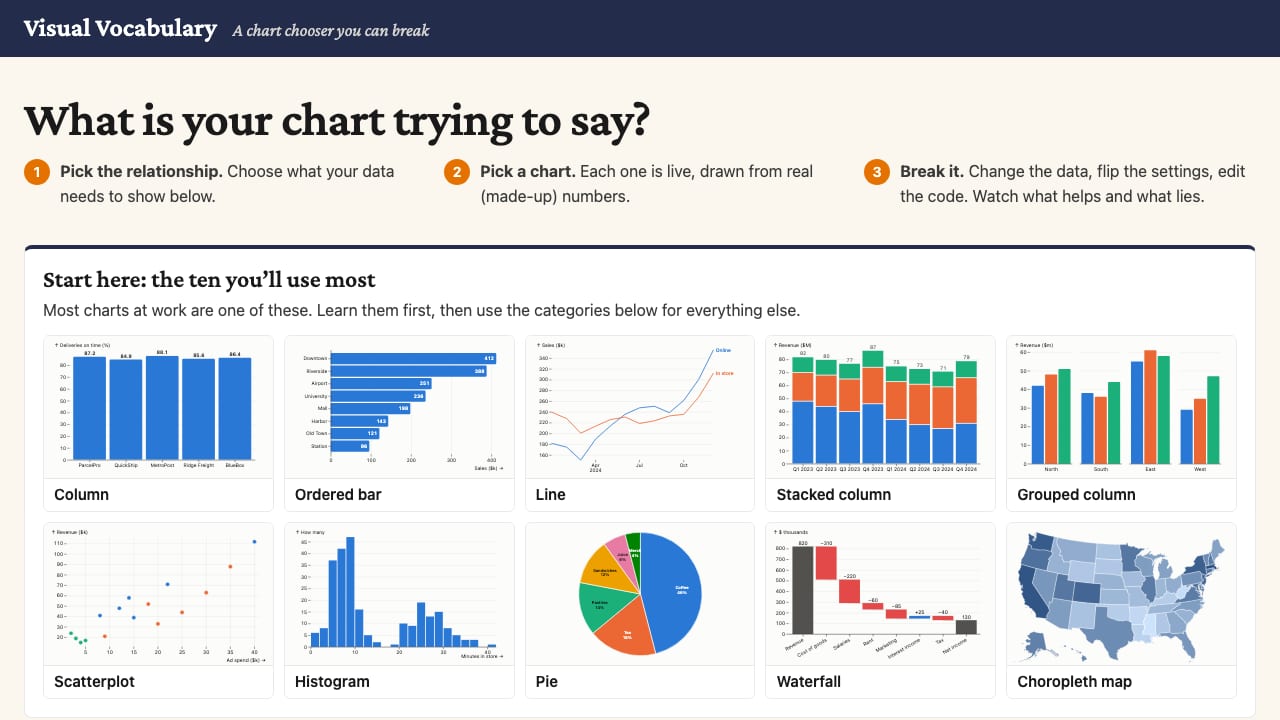
A chart chooser: pick what your data needs to show, then pick a chart that shows it. Every chart is live. Edit the data, change the settings, rewrite the code. Start with the ten charts most work is made of.
Interactive pages and readings I use in class, open to anyone.
Built and gathered for COMM 2003 at UVA McIntire.
A chart chooser: pick what your data needs to show, then pick a chart that shows it. Every chart is live. Edit the data, change the settings, rewrite the code. Start with the ten charts most work is made of.